Amazon Marketing Agency
A premium performance analytics dashboard that turns Amazon ad data into polished, client-ready reporting.
Project Type
Analytics Dashboard
Timeline
2 Weeks
My Role
Frontend Engineer & UI Designer
Status
Delivered
Raw Data, No Story — Clients Were Unimpressed
The agency was managing Amazon PPC campaigns for multiple clients but presenting raw spreadsheet exports as "reports." Clients found them difficult to read, questioned campaign value, and retention was suffering.
- Campaign data scattered across spreadsheets — no unified view of performance
- Clients received raw exports instead of polished, visual reports
- No real-time KPI tracking — performance was only visible after manual exports
- The agency's premium positioning wasn't reflected in their deliverables

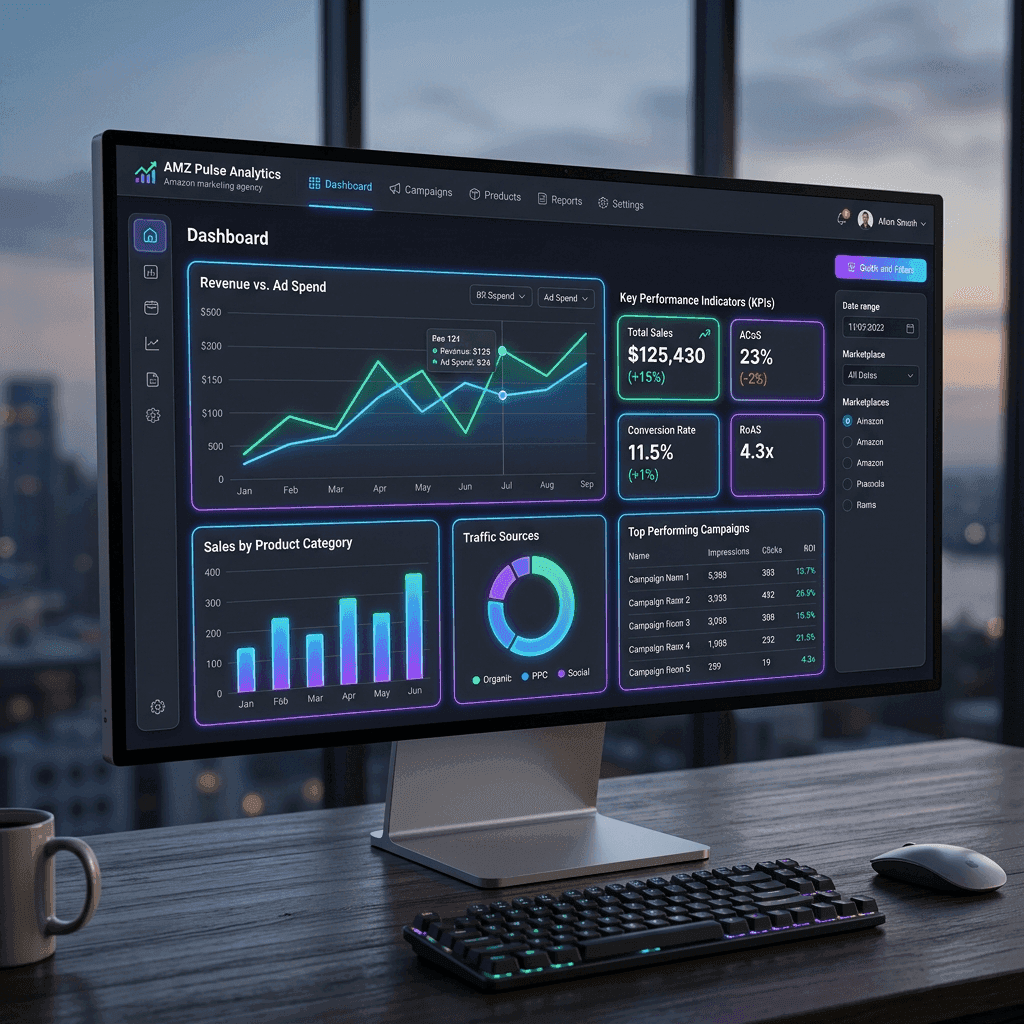
A Luxury Dark-Mode Analytics Dashboard
I designed and built a premium analytics dashboard the agency can present directly to clients — elegant visualisations, real-time trackers, and a luxury dark UI that communicates professionalism and data mastery.
Spend vs. Revenue Charts
D3-powered line and bar charts showing ad spend against revenue over time — with clear trend annotations and colour-coded performance zones.
ACOS & ROAS Trackers
Real-time KPI cards showing key metrics (ACOS, ROAS, CTR, Impressions) with sparklines and period-over-period deltas.
Keyword Ranking Grid
Sortable, searchable keyword performance table with bid recommendations and position trend indicators.
Framer Motion Animations
Smooth chart entrance animations and data transition effects that make the dashboard feel alive and premium, not static.
Luxury Dark Mode UI
Bespoke dark theme with curated colour palette — presentation-ready for client calls, boardroom screens, and PDF exports.
Multi-Campaign View
Agency can switch between client accounts and see all campaign performance in a single consolidated dashboard.

Data That Sells the Agency's Value
- Agency now presents polished dashboards instead of raw data exports
- Clients clearly see ROI — improving trust, retention, and upsell potential
- Real-time KPI cards reduce the time spent preparing for client calls
- Multi-campaign view saves the agency hours of manual consolidation
- Luxury UI reinforces the agency's premium market positioning
- Framer Motion animations create a memorable, WOW-factor first impression
.png)
.png)
.png)